Skip to content
MTR GROUP

MTR Latitude Study

Every rival, every county, 3 years ahead.

A competitive simulation of your markets, delivered as an interactive study for your footprint: a page for every county and the workbook behind it, opened by the named readers on your licence. It shows where the field is heading, which move beats that course, and how long the advantage holds, refreshed 4 times a year on the CMS calendar.

Your unfair advantage is a market you can play before you have to live it.

Model

See every rival's next move.

The whole board: every parent, every county, with market evolution and the threats the current landscape does not show yet, modeled together.

War-game

Win before you commit.

Rehearse your action against the field before you commit a single dollar of capital. Lose the bid cycle a thousand times in private, cheaply, before playing it once for keeps.

Stress-test

Survive every counter-move.

Each strategy is tested against thousands of scored worlds, each one a complete version of your market with every rival's move in it, and scored for durability: how much of the position survives when rivals respond.

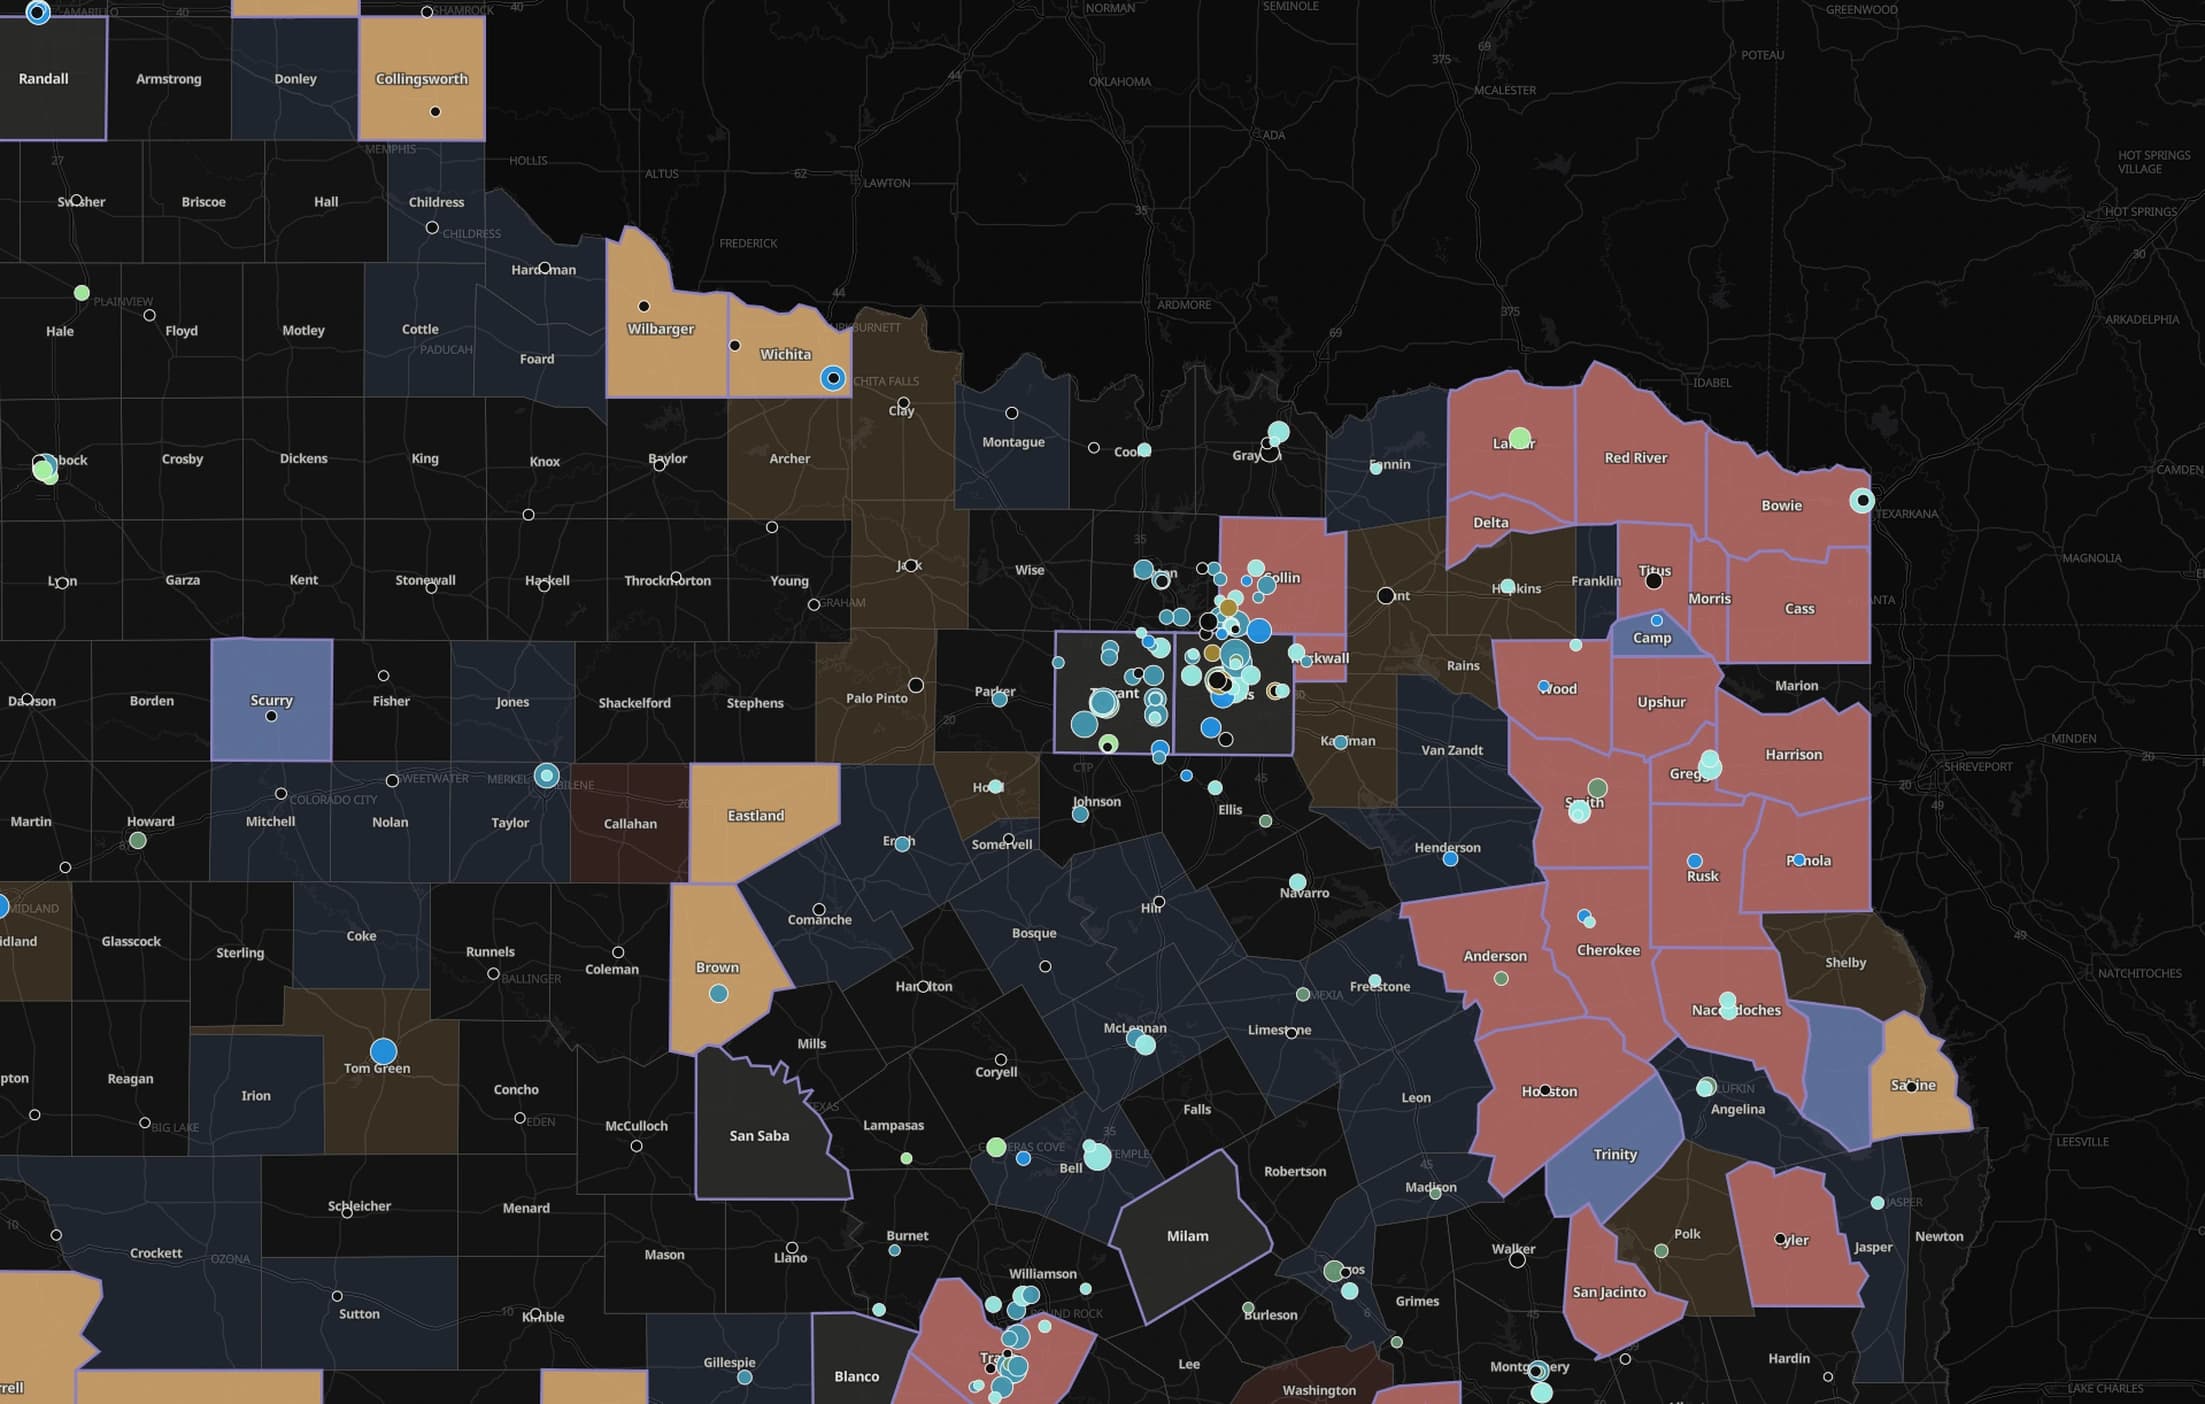
MTR Latitude Study map of Texas: counties from the Panhandle to the Gulf coast shaded by simulated competitive posture, with plan activity marked across every market
Texas · statewide
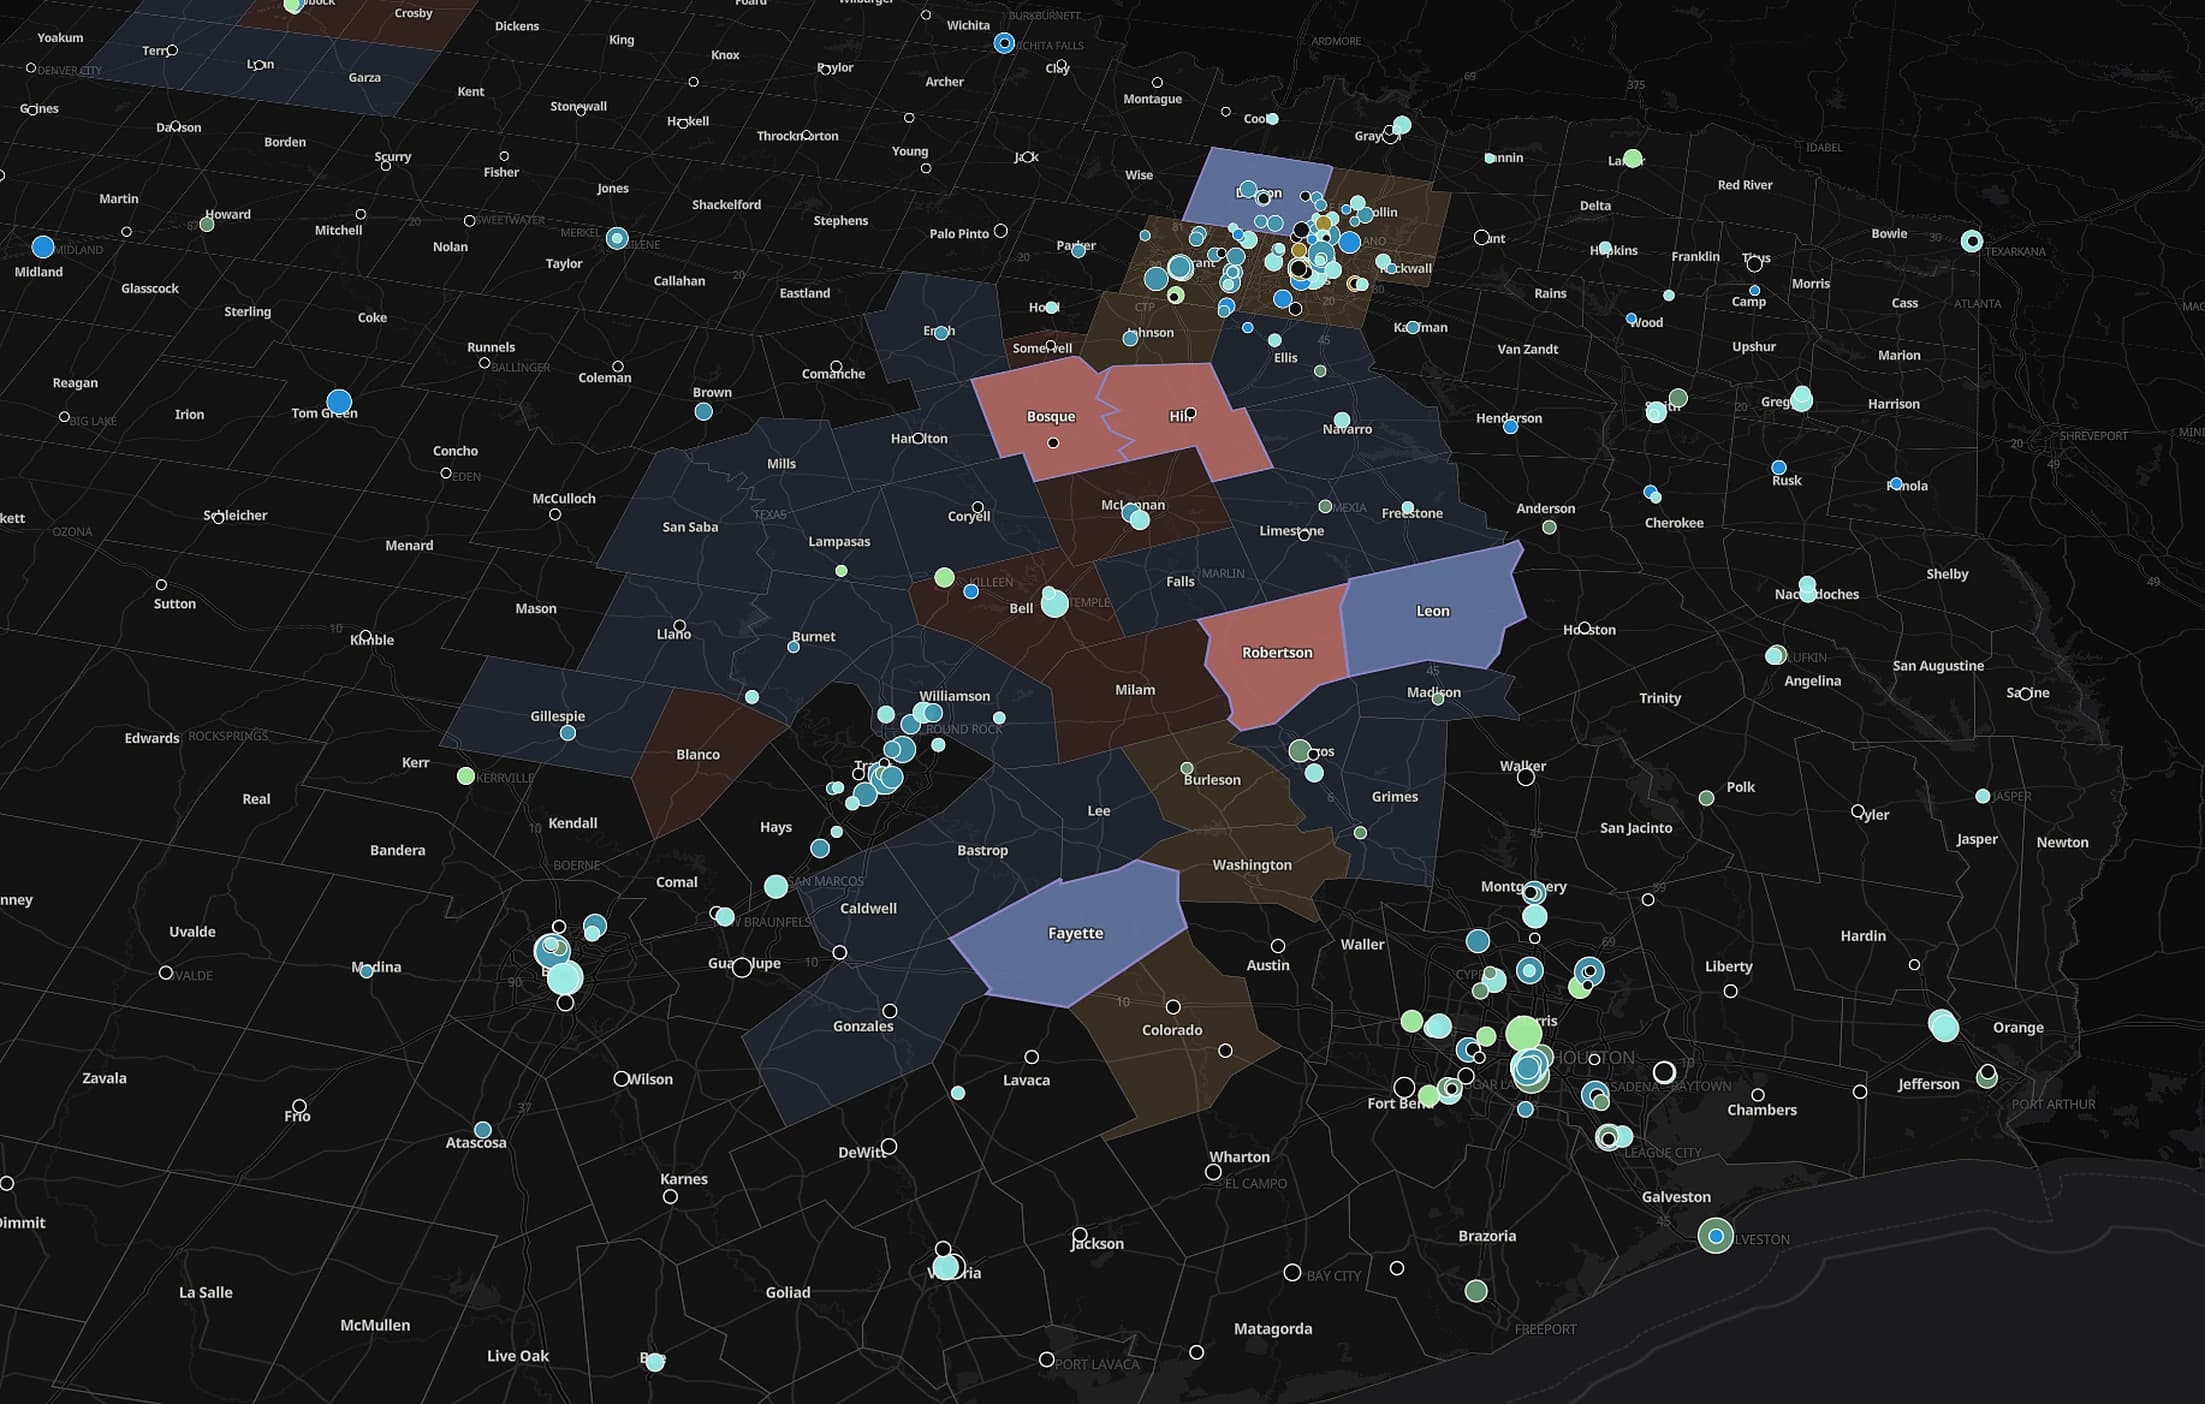
MTR Latitude Study map of Texas: a connected span of counties running from the Dallas and Fort Worth area south through Austin to the Gulf coast, shaded by simulated competitive posture
Texas · Dallas to the Gulf
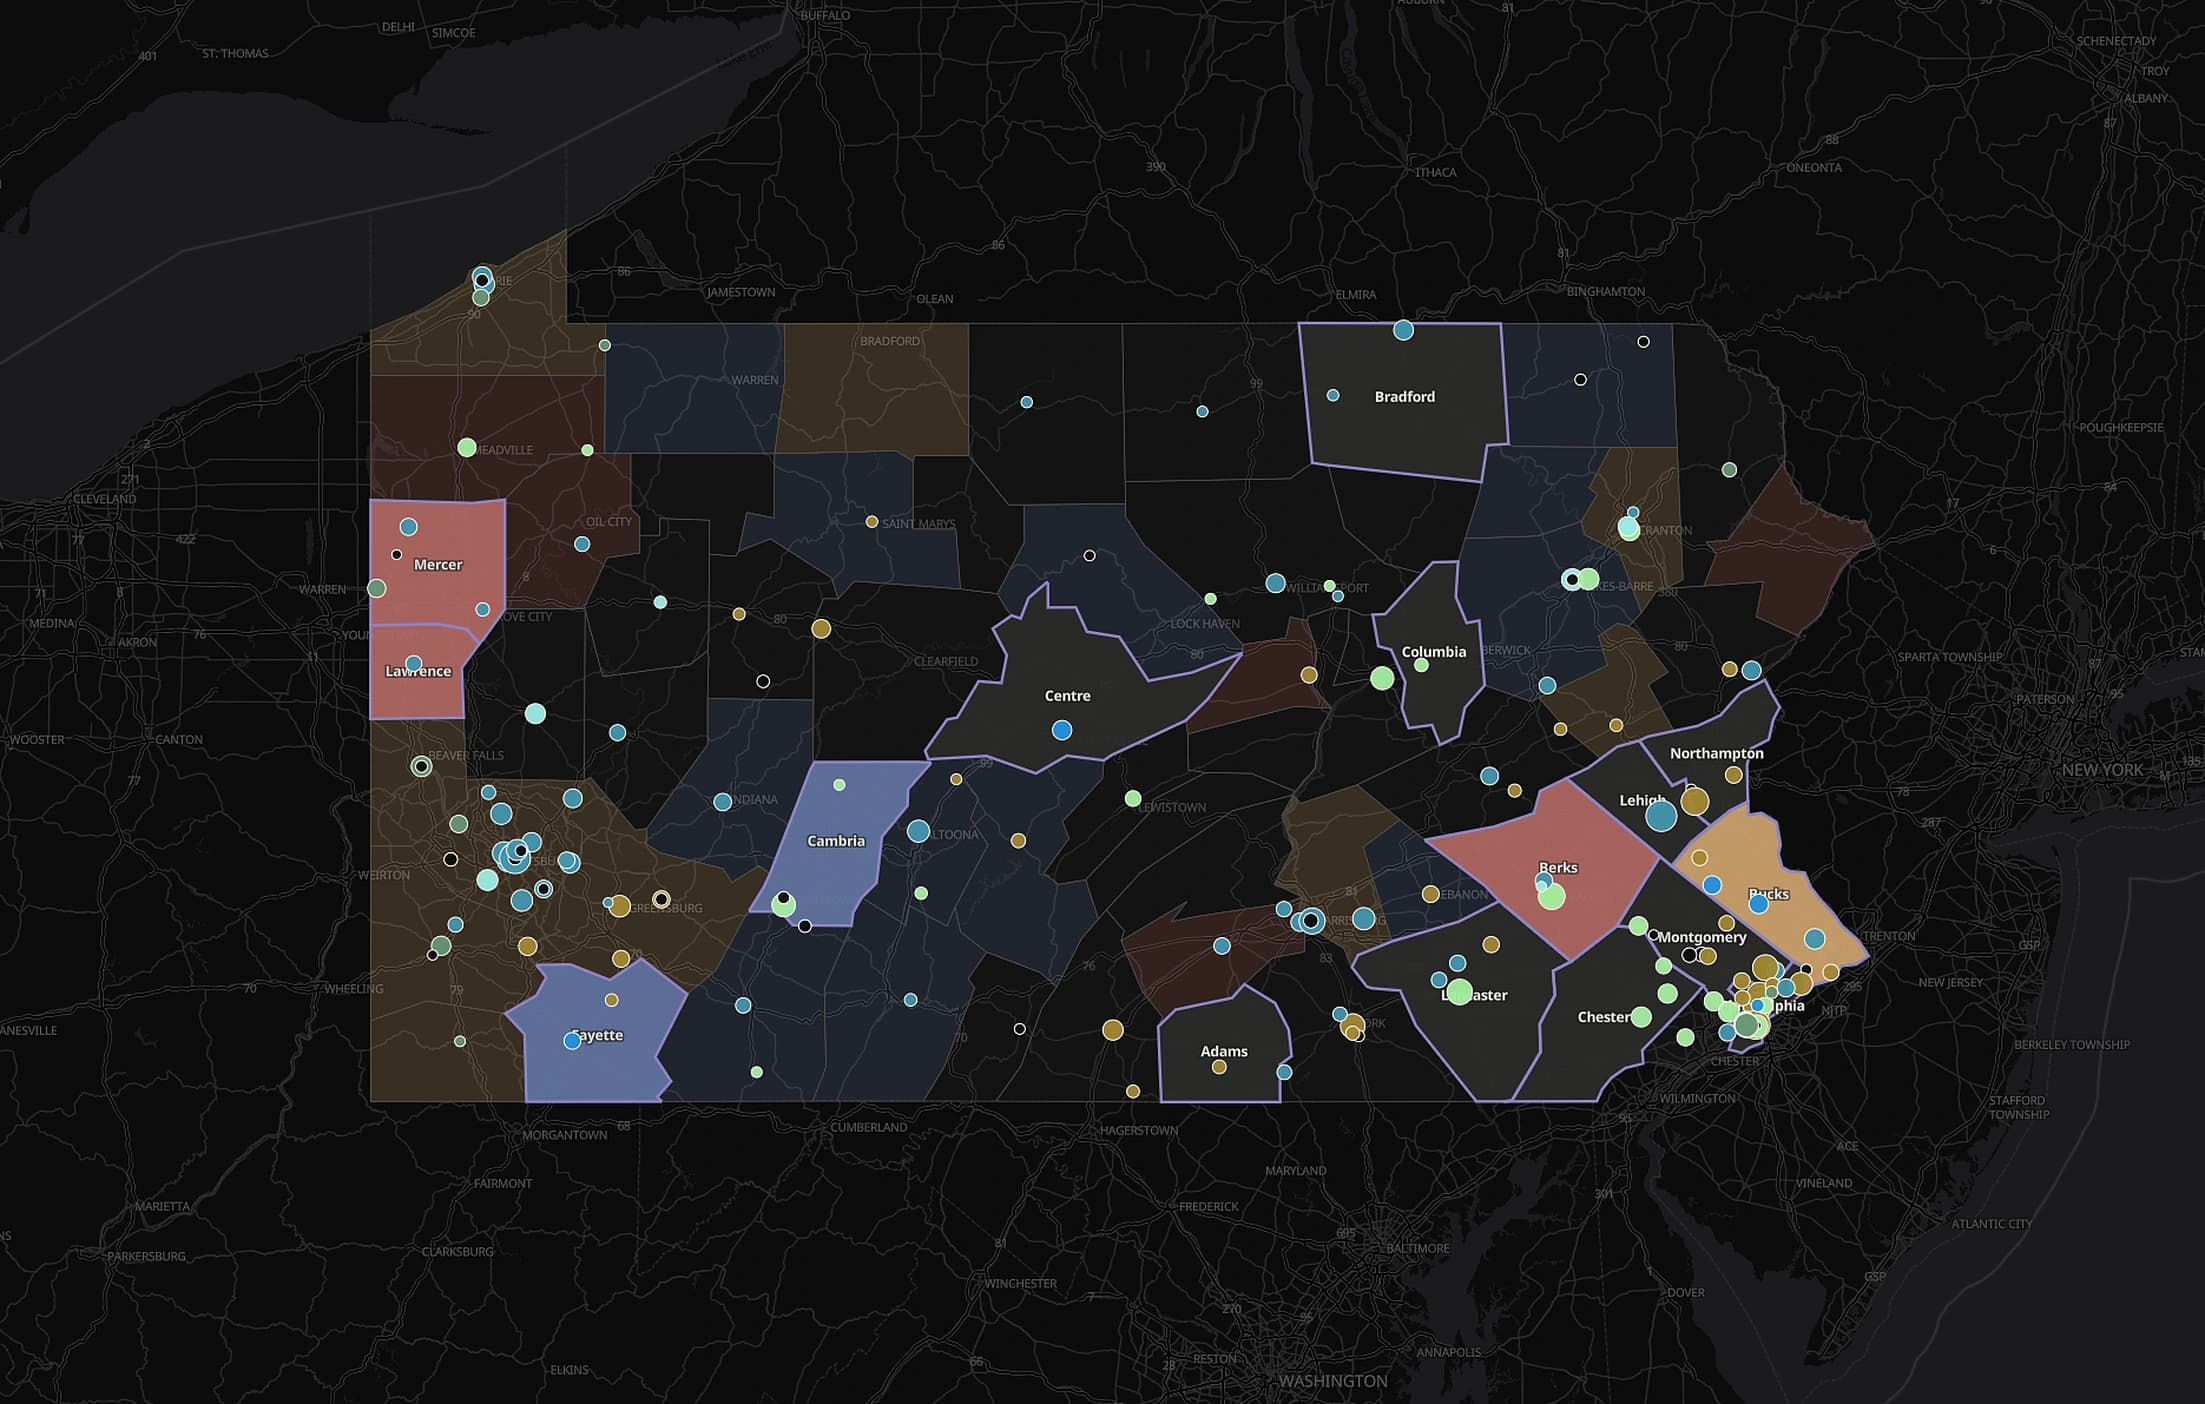
MTR Latitude Study map of Pennsylvania: counties across the whole state shaded by simulated competitive posture, with the neighbouring states visible around it
Pennsylvania · statewide
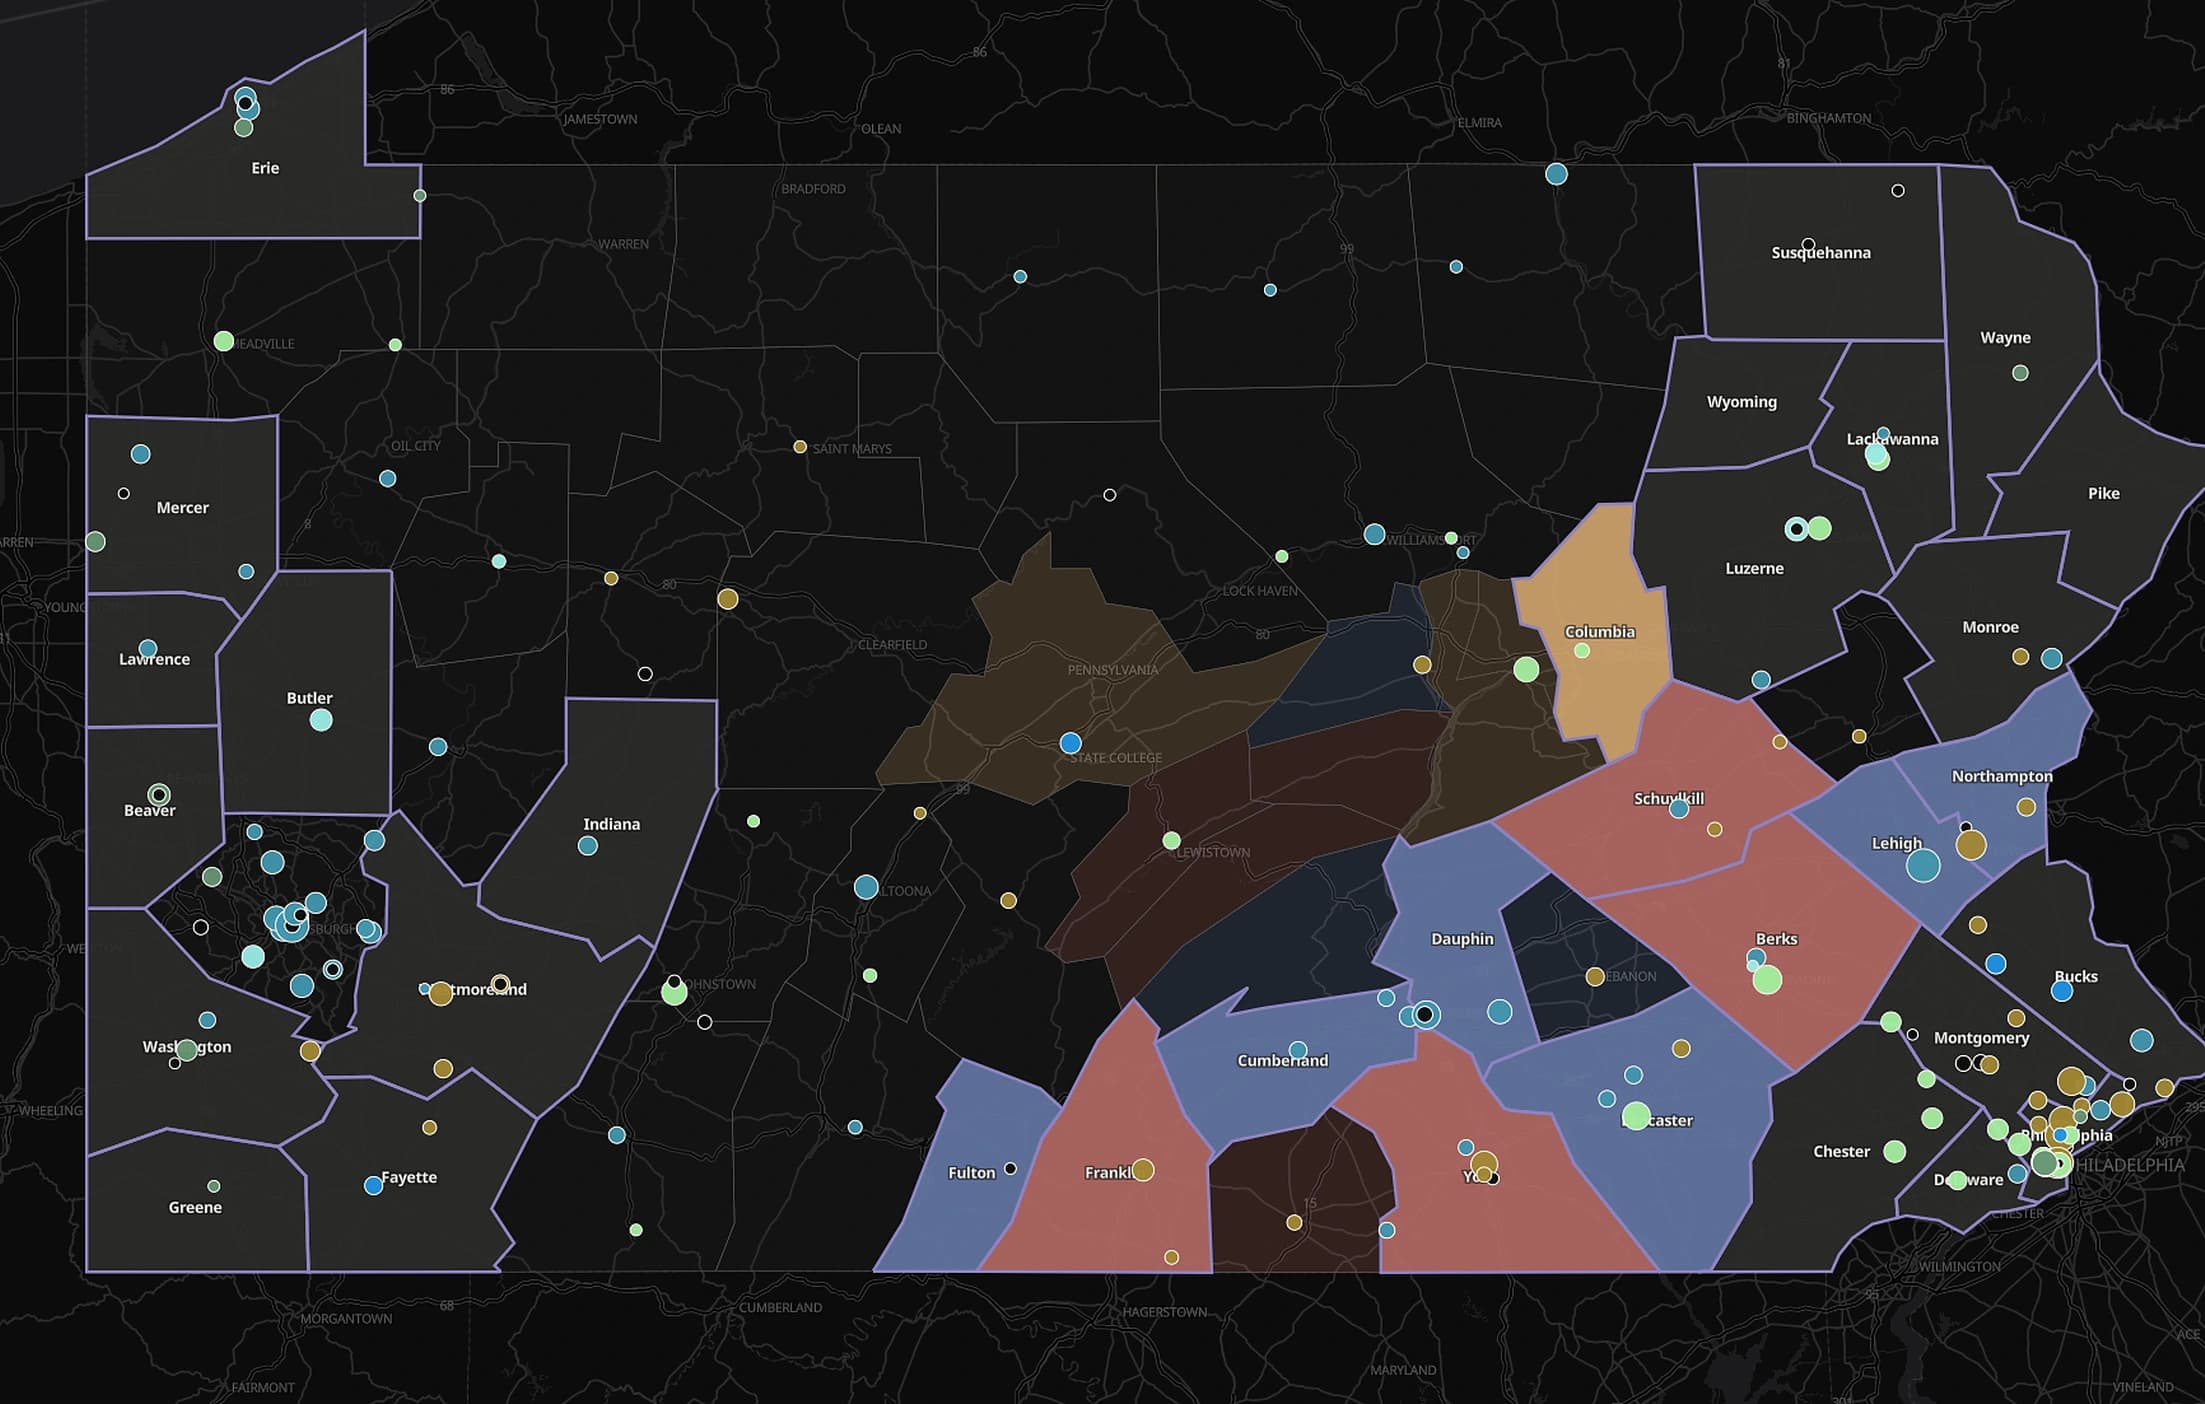
MTR Latitude Study map of Pennsylvania: two separated clusters of counties shaded by simulated competitive posture, with unshaded counties between them
Pennsylvania · footprint reach

Rehearse the year before you commit to it

The study is live. Put your own plan into it, push on the assumptions, and the board moves with you.

The controls filter and re-rank work the engine has already scored, which is why the answers hold up no matter how hard you push.

  1. Put your plan in first

    Mark what you intend to do, county by county, before the study shows you anything.

  2. See every move scored

    Open any county for all 7 actions, what each rival does in that world, and how durable each position is.

  3. Weight what you value

    Slide durability against upside and the whole market re-ranks live. Stored values never change.

  4. Compare and take it with you

    Put two strategies side by side, then export the scored plan as an addendum and a workbook tab.

What a county looks like when it lands

Every available action and posture the county was scored against and how rivals will likely respond.

How these figures are validated

MTR Latitude Study · County pageIllustrative · fictional carriers

Northwind Health Plan · plan year 2028

Hidalgo County, Texas

48215 · 3-year horizon

Recommended action

Develop

Frontier-supported · durability 0.78 of 1

Every action, scored across worlds consistent with 13 years of observed behavior

ActionOf consistent worldsWorldsSupportDurability
Develop71%3,427High0.78
Enter12%576Medium0.74
Hold9%432Medium0.66
Prepare Enter4%192Low0.61
Hold Out2%96Low0.44
Prepare Exit1%48Low0.39
Exit1%48Low0.31

Rival posture in the leading world

  • Gulf Star HealthHoldholds 3 adjacent counties
  • Rio Vista PlansDevelopexpanded here last cycle
  • Sabine MutualHold Outno position in county

Watchlist

Sabine Mutual is on the withdrawal watchlist in 2 counties in this footprint. Hidalgo is not one of them.

Watchlist entries name counties and state their limitation. The shares above are how often an action appears across consistent worlds, not the chance a carrier takes it. MTR does not report exit probabilities.

Provenance

Run
run-7f3a9c2b41e6
Model version
mfn-2026Q3-v5
Dataset version
cms-2026-05
Bundle schema
1.7.0

Illustrative. The carriers are fictional and the geography is real, so the structure and the rigor are visible without exposing any client's competitive position or characterizing any real organization.

4 releases a year, each timed to the decisions it informs

CMS publishes on a calendar, so each release is keyed to the publication events that change the answer, and influences the decisions that follow it.

  1. October

    The field reveals itself

    Every competitor's move for the coming plan year becomes public at once. This release reads the whole field against what the simulation projected, then seeds the next footprint cycle.

    Triggered by

    Landscape and crosswalk release (~Oct 1) · Star Ratings release (early Oct)

    Influences

    • Landscape release competitive deep-dive
    • Star Ratings release reaction
    • Market assessment refresh, county long-list
  2. January – February

    The planning year opens

    Share movement from the selling season is decomposed, and proposed rates are pushed through the competitive field to show who is squeezed hardest.

    Triggered by

    Part C application release (early Jan) · Advance Notice (late Jan) · February enrollment file (mid-Feb)

    Influences

    • Post-AEP autopsy and planning kickoff
    • Advance Notice impact modeling
  3. April

    The pricing sprint

    The 8 weeks between the Rate Announcement and the June bid lock are the decisive window. This release lands final benchmarks, county economics, and the guardrails that bound what rivals can buy down.

    Triggered by

    Final Rate Announcement and ratebook (~1st week Apr) · Part C bid review memo, TBC and MOOP (mid-Apr)

    Influences

    • Rate Announcement pricing sprint
    • Exit and SAR list finalization
  4. July

    Footprint and repair

    The bid is locked, so attention moves to the constrained repair window and to next year's map: which counties to file for, and which to leave.

    Triggered by

    Benchmark publication (late Jul)

    Influences

    • Desk review and rebate reallocation
    • Market assessment refresh, county long-list
    • Network feasibility screen and footprint go/no-go

2 intelligence lines deliver the full strategic picture

Every MTR product runs on the same 2 intelligence lines. Foresight establishes where the market is heading without you. Frontier finds where a deliberate move changes that, and whether the change survives the response.

MTR Foresight

Where the market goes on its own

What happens if everybody plays like they typically do?

Foresight reads where each market travels under its own momentum: who enters, who expands, who withdraws, county by county, across the whole competitive field rather than a sampled subset.

  • County-level entry and expansion forecasting
  • Early-warning watchlist for withdrawal pressure
  • Market trajectory across a 3-year horizon
  • Carrier-by-carrier posture in every county you cover

Entry and expansion forecasting is validated against held-out years, meaning years the model was never shown. Withdrawal signals travel as a watchlist, not a prediction.

MTR Frontier

Where a deliberate move beats it

What should we do about it, and will it hold?

Frontier builds on that trajectory. It finds the moves that beat the market's own course, tests each one against how rivals are modeled to respond, and reports how durable the advantage is rather than only how large.

  • Best-action ranking against the modeled field
  • Counter-move stress testing for durability
  • Rival-seat views: the board from a competitor's chair
  • Support tiering on every recommendation: how much of the scored field backs it, as High, Medium, or Low

Rival-seat views are specific to Frontier. Equilibrium output, meaning which market configurations hold once every rival has responded, is presented as structural characterization, not point prediction.

Foresight is available on its own · Frontier includes Foresight

Master the cycles underneath the snapshot.

See openings first, evaluate how durable each one is, avoid false leads, and use competitors' blind spots.

Reduce uncertainty in territory and product planning
The footprint and benefit decisions that matter are made between January and June, against a field that does not publish until October. The study covers that window rather than reporting on it afterward.
Stabilize profitability and defend growth
MTR does not compute margin and does not claim to. It shows where your position holds across the scored field and where it thins, so the counties you defend and the ones you concede are chosen rather than discovered.
Develop contingency plans for market shocks
Every recommendation carries the branches it was scored against. When a rival moves differently than expected, the alternative is already computed rather than waiting to be commissioned.
Position against how rivals will respond
Rival-seat views put you in a competitor's chair on the same board. Your move is chosen against how the field is modeled to respond, not against what it filed last year.

Built to be used, and to be checked

Every county, not a sample

Coverage runs to every county in your footprint and every carrier competing in it, so the answer does not depend on which markets someone had time to analyze.

No PHI, no integration

The study is built from public data. Nothing connects to your systems, which takes security review, data agreements, and IT scheduling off the critical path.

Reproducible by construction

Every figure traces to the run, model version, and dataset that produced it. Your actuaries and model risk team can audit the chain rather than take it on faith.

Replaces a consulting engagement

The work a strategy firm would scope over months, delivered as a standing subscription that refreshes when the market actually changes. For questions the study does not already answer, MTR also scopes custom market intelligence projects.

See it run on your market

Book a live demo on the counties you name.