
For investors
See growth and risk before the filings do
Public disclosures describe the market as it was. MTR simulates where it is going: which carriers face structural pressure, which footprints are defensible, and where the next entries and exits are likely.
How the study works from your seat
Model every carrier at county resolution, compute what the field is positioned to do next, then weight each result by how much structural support it carries: how much of the scored field backs it once every rival has responded.
Model
Position, county by county
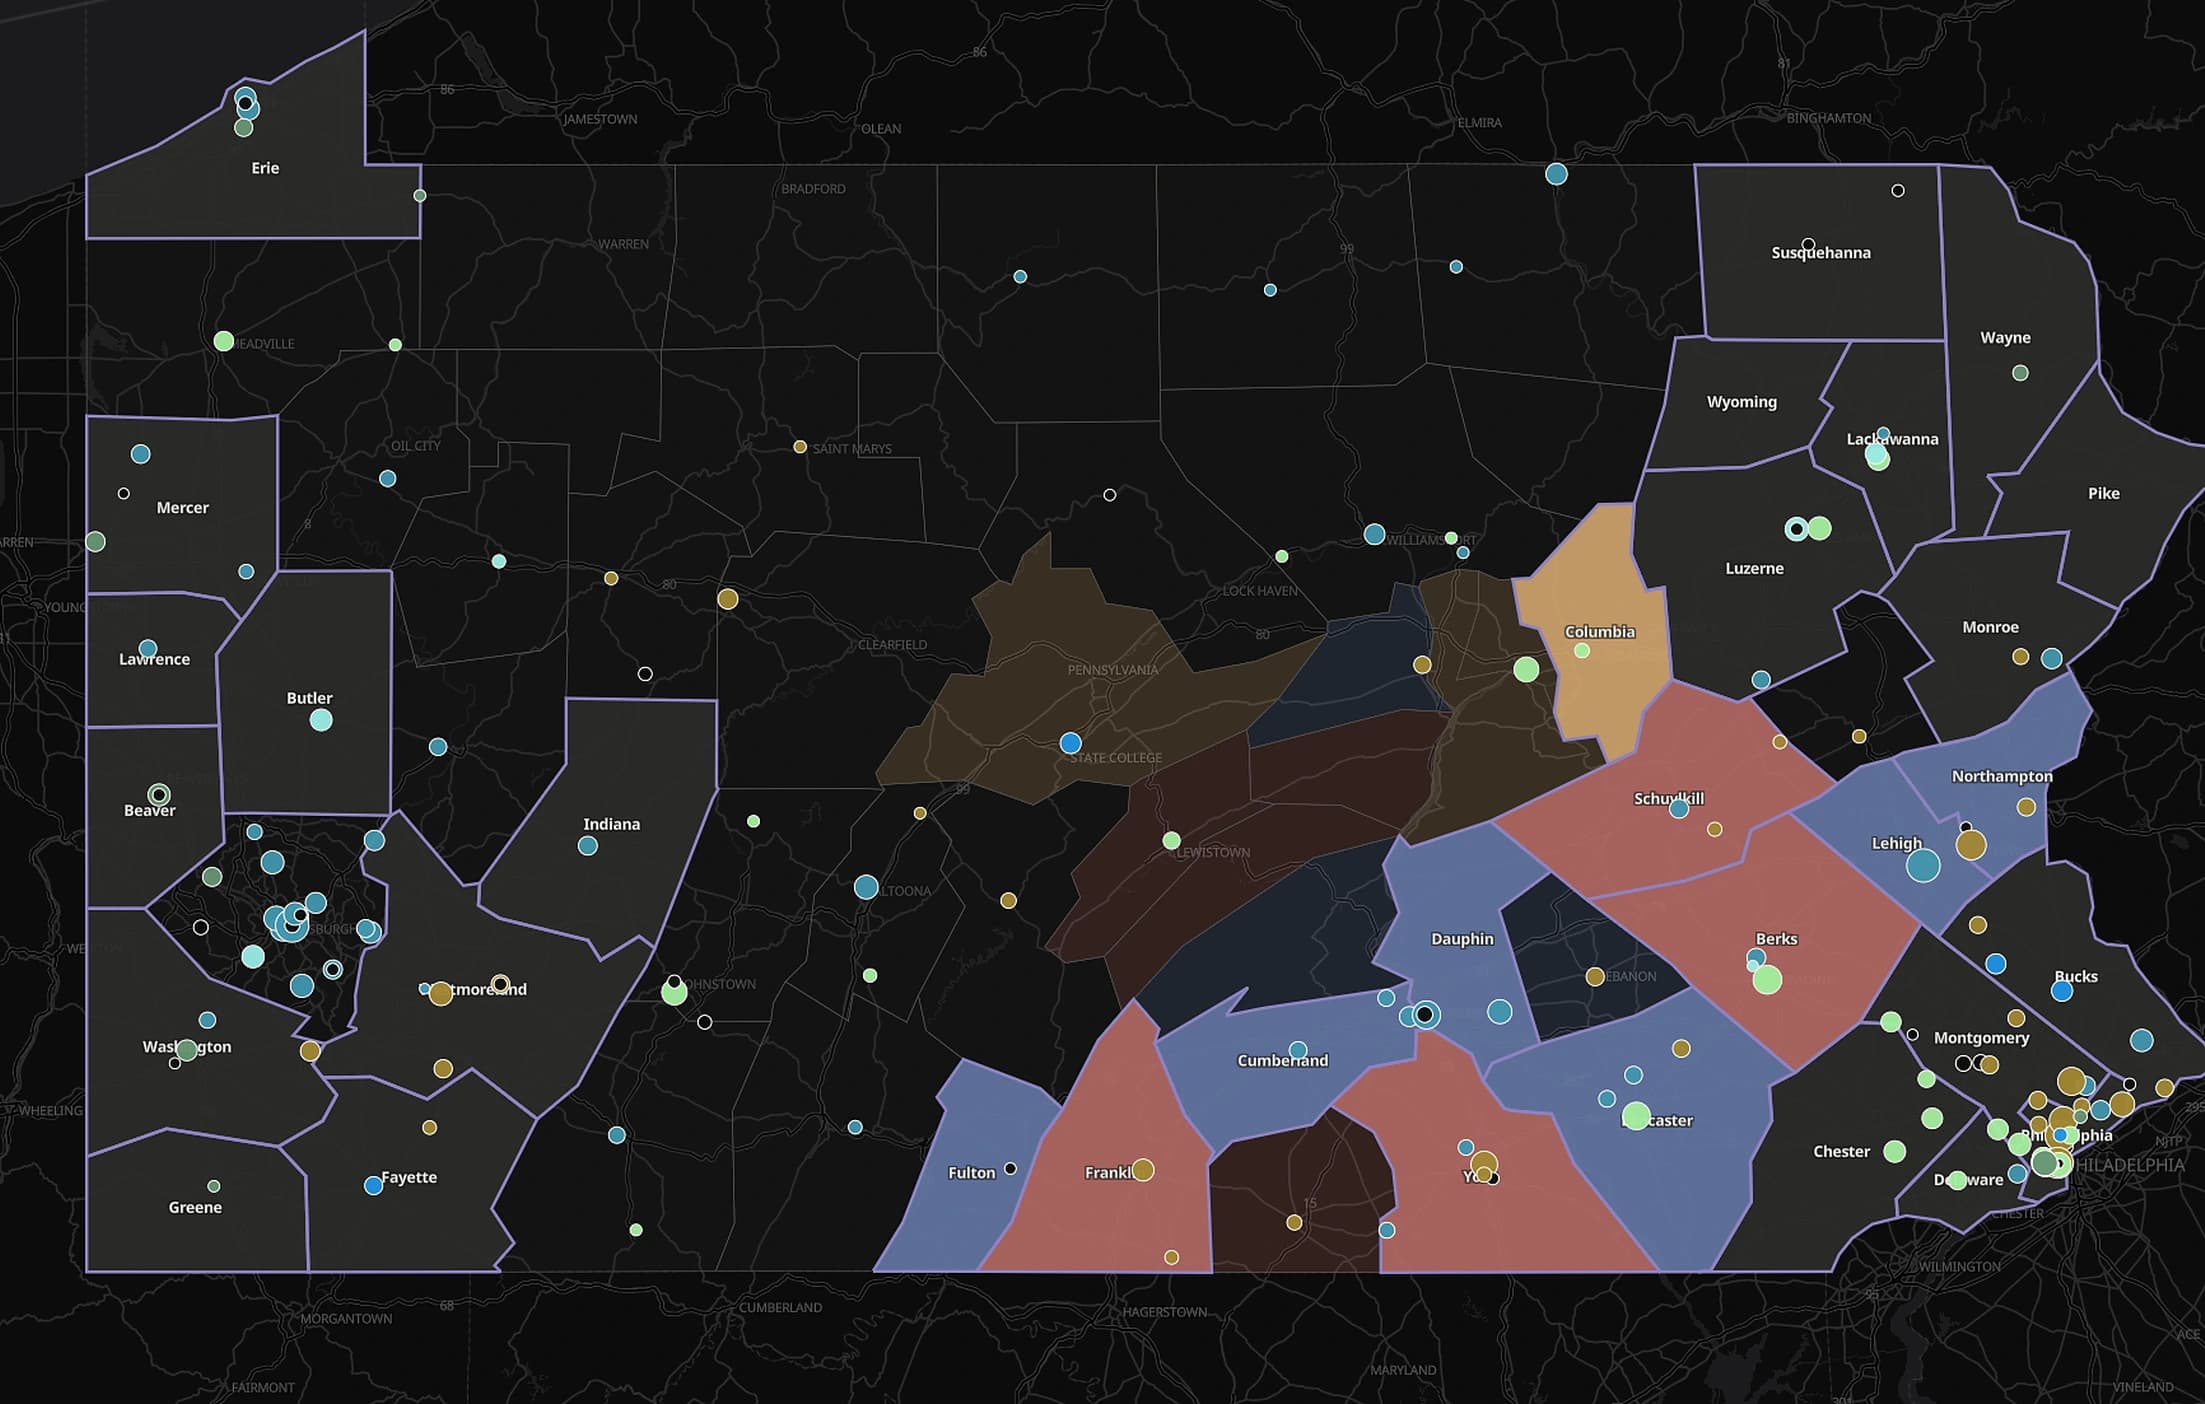
A carrier is not one business. It is a competitor in thousands of separate county contests, and the study computes every one of them, for every carrier, rather than reading a consolidated segment margin.
War-game
Read the months no one else can
Bids lock in June and stay confidential until the landscape files publish in the autumn. The simulation runs the competitive field across that gap, from inputs that are entirely public.
Stress-test
Separate a defensible position from a held one
Positions are scored across thousands of worlds, each one a complete version of the market with every carrier's move in it, for durability, how much of a position survives when the field responds. That distinguishes a carrier compounding a real advantage from one holding ground it will have to buy back.
4 releases, timed to the disclosure calendar
Medicare Advantage discloses itself on a fixed schedule that has nothing to do with the reporting calendar. The gaps between the two are where the analytical work is.
October
The field reveals itself
Landscape, crosswalk, and Star Ratings publish together: footprints, benefit richness, premiums, and quality for every carrier at once. The largest information event of the year, and it is public.
January – February
The first honest read on the season
County-level enrollment files show who actually won the selling season, carrier by carrier and county by county, before it is characterized on a call.
April
Next year's margin math is set
The Rate Announcement fixes the parameters every carrier prices against. What each of them can afford in each county follows from it, and is computable then rather than in October.
July
The blackout
Bids are locked and confidential. Positioning for the coming year is decided and invisible, which is exactly the interval a simulation of the field is for.
Where it lands inside the process
One study, read for the question each part of the process has to answer.
- Coverage and monitoring
- Where each carrier is positioned to grow or retrench, county by county, between disclosures.
- Early warning
- Counties where a carrier's position carries the least durability, named as a watchlist with the limitation stated.
- Diligence
- The local competitive field around an asset, rather than a national share table that says nothing about its markets.
- Payer-mix concentration risk
- For provider, MSO, and risk-bearing assets: how exposed the revenue is to one carrier retrenching in its counties.
- Thesis testing
- Whether a growth story survives the modeled response of every rival competing for the same lives.
- Compliance posture
- Public inputs, deterministic outputs, and full provenance, so the basis of a view is documentable.
What you are buying
An analytical edge over public data, documented well enough that its basis can be shown to anyone who asks.
Public data, entirely
Built from public sources, with no protected health information and no confidential filings. The edge is in the computation rather than in the access, which is the only durable kind.
County resolution, every carrier
Coverage runs to every county and every carrier competing in it, so a position is assessed where it is actually contested rather than at segment level.
Documentable by construction
Deterministic and content-addressed: any figure recovers from the run, model version, and dataset version behind it, so the basis of a view survives review.
Claims kept inside the evidence
Withdrawal signals travel as an early-warning watchlist rather than as probabilities, and equilibrium output, meaning which market configurations hold once every rival has responded, is structural characterization rather than point forecast. No security-level views, and no investment advice.
See it run on your market
A live walkthrough of the Latitude Study on the counties that matter to you.