
For policy & research
A reproducible model of market behavior
MTR output is deterministic and content-addressed: every result is recoverable from the run, code version, and data that produced it. That makes it usable evidence for regulatory, legal, and academic work.
How the study works from your seat
Model the county-level field from public inputs, compute what happens under a different rule or a different move, then report how much structural support the result carries: how much of the scored field backs it once every participant has responded.
Model
County structure, computed rather than described
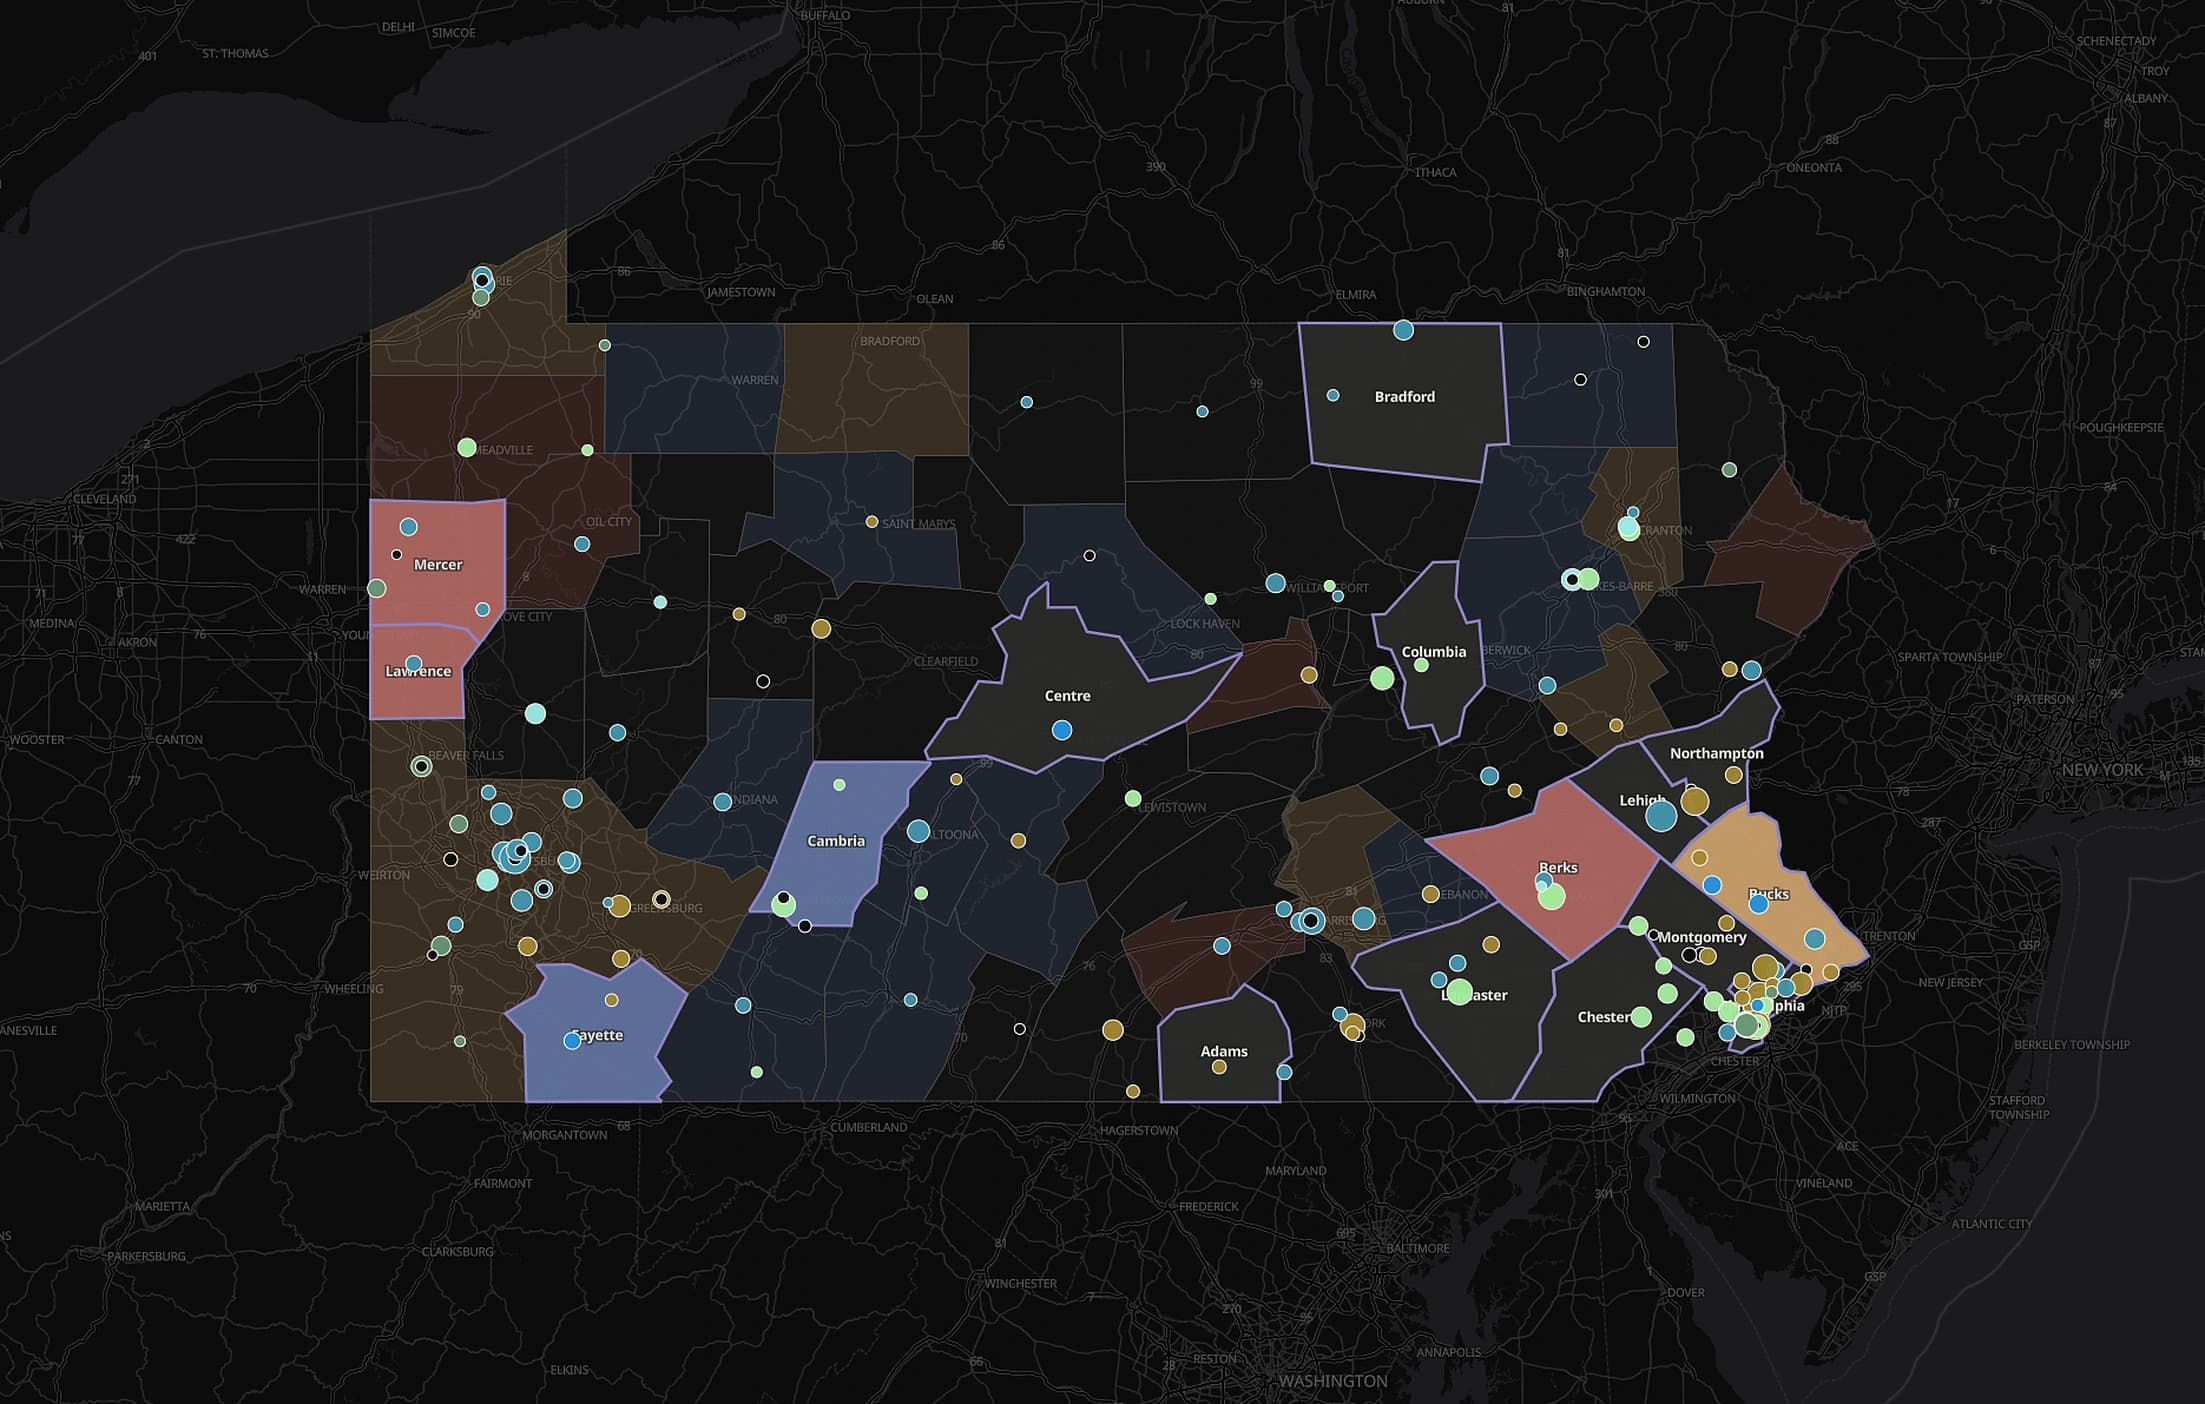
Every carrier in every county, typed from 13 years of observed behavior. A concentration measure describes a market's shape; this computes how the participants in it are positioned to act.
War-game
Counterfactuals you can actually run
The engine computes equilibria, the configurations that hold once every participant has responded, over a space of possible market configurations, so a question about a different benchmark, a different entrant, or a different footprint is a computation rather than an assertion.
Stress-test
Findings that state their own support
Results carry structural confidence tiering, and where support is weak the output says so rather than smoothing it into a single confident number. A finding that cannot be defended is worth less than no finding.
4 releases, timed to the evidence cycle
The questions change on a fixed schedule because the data and the rulemaking do. Each release lands against the moment its evidence is needed.
October
The observational record lands
Landscape, crosswalk, and Star Ratings publish together, fixing the year's county-level market structure. What carriers actually did becomes checkable against what was projected.
January – February
The rule opens for comment
The Advance Notice is pushed through the competitive field, so the distributional question, which carriers and which counties absorb a proposed change, can be answered inside the comment window.
April
The rule becomes final
The Rate Announcement sets the parameters carriers price against. The distance between what was proposed and what was finalized is measurable, county by county.
July
Benchmarks and the following year
Benchmark and NAMBA publication close the loop on county economics and open the question of which counties carriers will file for next.
Where it lands inside the work
One study, read for the question each kind of work has to answer.
- Regulatory and rulemaking analysis
- Which carriers and which counties absorb a proposed change, computed rather than argued from aggregates.
- Market definition and concentration
- County-level structure with the participants' modeled behavior attached, not only a share distribution.
- Expert testimony
- Deterministic output where every figure recovers from the run, model version, and dataset that produced it.
- Litigation support
- Counterfactual market states computed under a defined alternative, with the strength of each result stated.
- Academic research
- A reproducible model of insurer behavior built entirely from public inputs, citable by construction.
- Program evaluation
- What the field did against what the model projected, graded on the same county basis every year.
What you are buying
A model built to be checked by someone trying to break it, which is the only useful standard in this work.
Reproducible by construction
Every output is deterministic and content-addressed. Any figure recovers from the run, model version, and dataset version that produced it, and a study refuses to render against a store that does not match.
Public inputs, end to end
Built entirely from public data. No protected health information and no confidential filings are involved, so the provenance of every input can be stated plainly.
Every county, not a sample
Coverage runs to every county and every carrier competing in it, which is what makes an entry or concentration question answerable nationally rather than illustratively.
Limits stated, not smoothed
Withdrawal signals travel as an early-warning watchlist rather than as probabilities, and equilibrium output is presented as structural characterization rather than point forecast.
See it run on your market
A live walkthrough of the Latitude Study on the counties that matter to you.